View Temperature Sensor Details in Graphical Format
This is a customizable graph, for a selected reefer, which displays temperature readings for setpoint, return (circulated air returned to bulkhead), and supply (how hard the fridge is working to keep running at a specific temperature) as lines on a graph for a specific date, including the time of day, location, status (arrived, departed), and status duration.
-
From Live Map > Asset Dashboard, in the Asset Inventory list (2), click a reefer asset that has an installed temperature sensor.
-
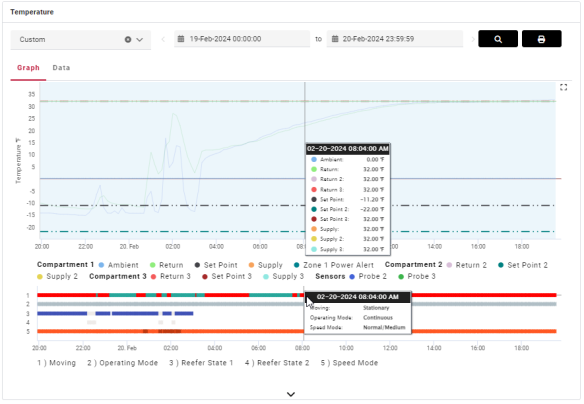
In the Temperature widget, click Graph.
-
Hover over any data point on the graph to see additional details.
-
Click the labels at the bottom of the graph to toggle the items on and off (show/hide). In this example, ambient and set point data for compartment 1 are no longer shown in the line graph or in the data point list.

-
Click
 to enlarge the graph to full screen size.
-